wisemonkeys logo
FeedNotificationProfileManage Forms
FeedNotificationSearchSign in
wisemonkeys logo

Blogs

Data Visualization in Decision-Making

profile
29_Vivek vakode
Sep 19, 2025
1 Like
0 Discussions
0 Reads

Introduction

Data Visualization means showing data through charts and graphs instead of long tables. It makes information easy and quick to understand. In Data Science, it helps turn complex data into simple insights for better decisions.

Importance in Decision Making

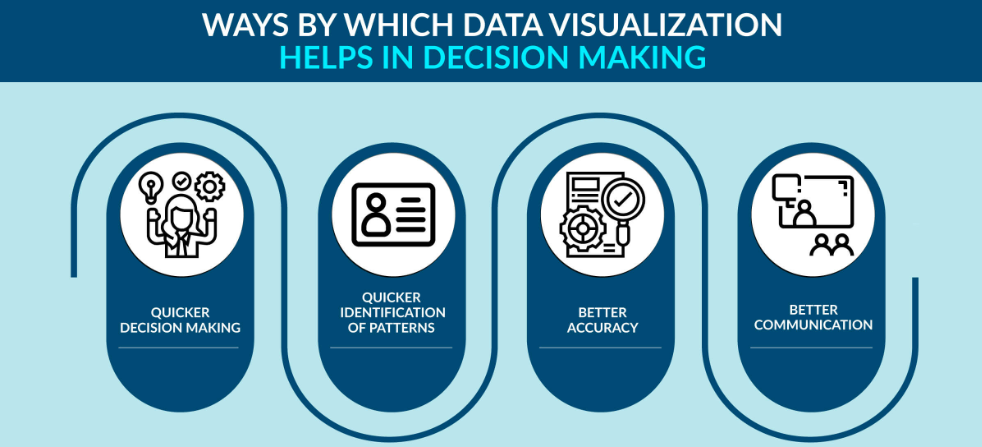
Graphs help people see patterns and trends quickly. Instead of reading huge tables, a simple chart explains the same story in seconds. It saves time, avoids confusion, and helps in correct decisions.

Real-Life Examples

1. Retail Store Sales – A bar chart shows which product sells most.(example) A shop records sales of products A, B, C, and D. A bar chart shows Product A sells the most, so the shopkeeper stocks more of it and improves sales planning.

2. COVID-19 Cases – Governments used line graphs and heatmaps to track rising cases and decide on lockdowns or extra hospitals.

Techniques of Visualization

• Bar and Pie Charts – Compare categories.

• Line Graphs – Show trends.

• Heatmaps – Show patterns.

• Dashboards – Combine charts.

• Scatter Plots & Histograms – Show distribution and relationships.

Applications

• Business – Sales and profits.

• Healthcare – Patient tracking.

• Education – Check student performance and progress.

• Government – Use survey data for planning and policies.

Conclusion

Data Visualization turns numbers into simple visuals. It makes decision-making faster and smarter. In short, visualization makes data easy to understand and helps in better planning.


Comments ()


Sign in

Read Next

SPEM

Blog banner

My favourite food

Blog banner

INTERNET

Blog banner

The Laws of Karma

Blog banner

Operating system

Blog banner

URL vs Domain

Blog banner

CONCURRENCY

Blog banner

Memory hierarchy

Blog banner

ProofHub

Blog banner

A Brief Review on Cyber Forensics and its Analysis Tool

Blog banner

Memory Partitioning

Blog banner

Why Does Hierarchy Still matter in Organizations?

Blog banner

Health and fitness in technology

Blog banner

Is Social Media Marketing The Next Wave Of Digital Marketing?

Blog banner

The Right way of cooking

Blog banner

Europe Through My Lens

Blog banner

Kafka - A Framework

Blog banner

**THE MUJAWARR: Transforming the Logistics Industry**

Blog banner

Top 3 Places To Stay In Vienna

Blog banner

Starvation

Blog banner

Denial-of-Service and Distributed Denial-of-Service Attack Techniques

Blog banner

MD5 Collisions and the impact on computer forensics

Blog banner

Cloud Forensic Tools And Storage :A Review Paper

Blog banner

Message Passing in OS

Blog banner

objectives and function of operating system

Blog banner

USES OF WHATSAPP

Blog banner

The Rise of Evil Twin Attacks: A New Kind Of Spoofing Cyberattack

Blog banner

Stories Woven in Silk: The Meaning Behind Patola Motifs

Blog banner

Preparing Students for Higher Education: How International Schools Shape Future Success

Blog banner

Kernel Memory Allocation In Linux.

Blog banner

What are Tenders its various types

Blog banner

Blockchain in IoT Applications

Blog banner

Smart Shoephone: Is that technology overdose!?

Blog banner

Image Steganography: Hiding Secrets in Plain Sight

Blog banner

Deadlock

Blog banner

Man VS Nature

Blog banner

Photography

Blog banner

Fault Tolerance in an Operating System

Blog banner

Race Condition in Operating Theatre

Blog banner

"Life as a Part-time Student"

Blog banner

VIRTUAL MACHINE

Blog banner

Meal Maharaj — 3 CP, 5 CP, 8 CP. Same Love, Different Portions

Blog banner