
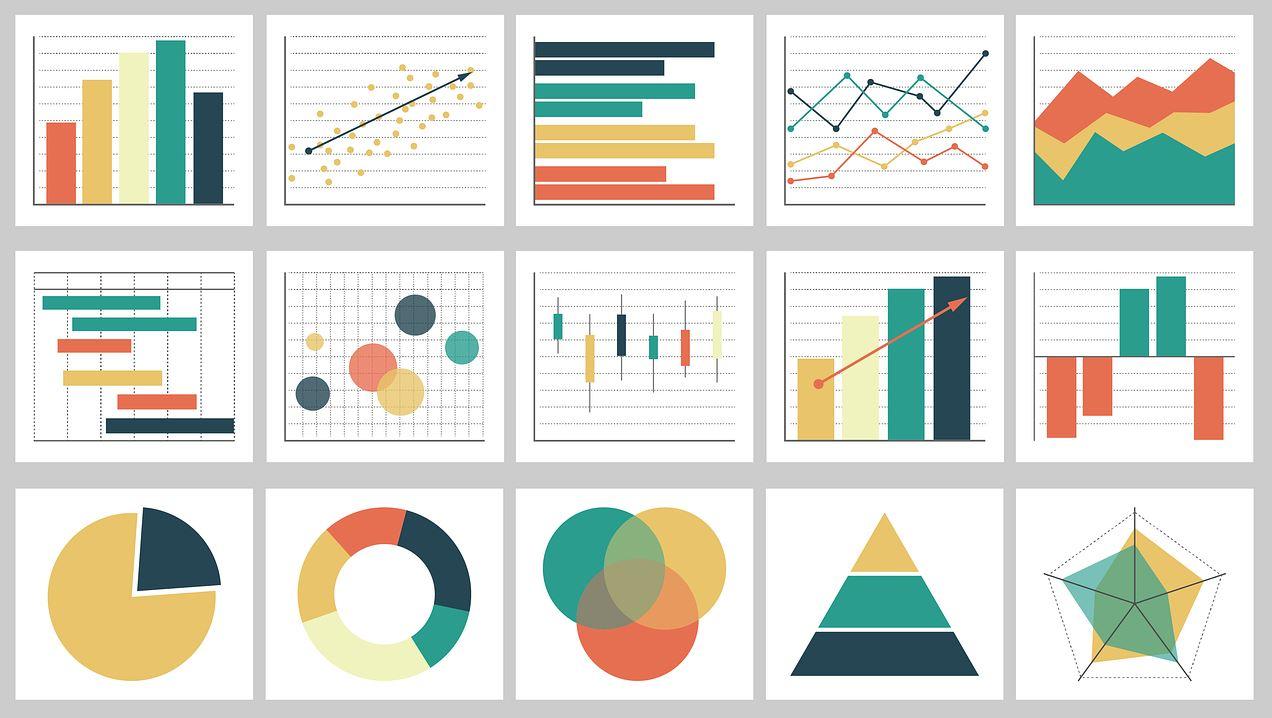
Visualization ek aisa process hai jismein data ko graphical format mein represent kiya jaata hai, couse complex information ko understand aur analyze karna easy ho jaye. Data science mein, visualization ka intension large datasets ko effectively interpret karna hota hai, jisse data ke patterns, trends, aur insights ko identify kiya ja sake. Graphical representation, jaise charts aur graphs, data ko ek aise format mein convert karti hai jo zyada intuitive aur easy-to-understand hota hai. Bar charts, pie charts, aur line graphs data visualization ke basic types hain, jo alag-alag data aspects ko highlight karte hain. Bar charts category-wise data comparisons mein help karte hain, pie charts proportionate data visualization ke liye use hote hain, aur line graphs trends aur time-based changes ko track karte hain. In tools ka use karke, users complex data ko visual insights mein convert kar sakte hain, jo decision-making aur strategic planning ko support karte hain.
Data visualization tools ka selection bhi important hai, jisse data ko effectively present kiya ja sake. Tools jaise Tableau, Power BI, aur Matplotlib data visualization ke liye commonly use kiye jaate hain. Tableau aur Power BI interactive dashboards aur diverse graphical options provide karte hain, jo complex datasets ko user-friendly visual formats mein convert karte hain. Matplotlib, Python programming language ka ek powerful library hai, jo extensive visualization capabilities offer karta hai. Effective visualization ke liye clear aur concise presentation important hai, isliye chart titles, axis labels, aur legends ka proper use kiya jana chahiye. Yeh elements data ko accurately represent karne aur samajhne mein help karte hain. Visualization ka ek aur crucial role data-driven decision-making mein hota hai; jab stakeholders ko data insights ki visual representation milti hai, to unhe informed decisions lene mein asaani hoti hai. Interactive visualizations, jaise real-time graphs aur dashboards, dynamic aur up-to-date information provide karte hain, jo data exploration aur scenario simulation ko efficient aur effective banate hain. Overall, visualization data science ka ek fundamental aspect hai jo complex data ko actionable insights mein convert karta hai, helping to drive better decisions and strategic actions.